
Q1 2026 Performance
It is quarterly reporting time. Did our portfolios perform across the risk reward curve as designed? For an overview of individual portfolio positioning, click here.
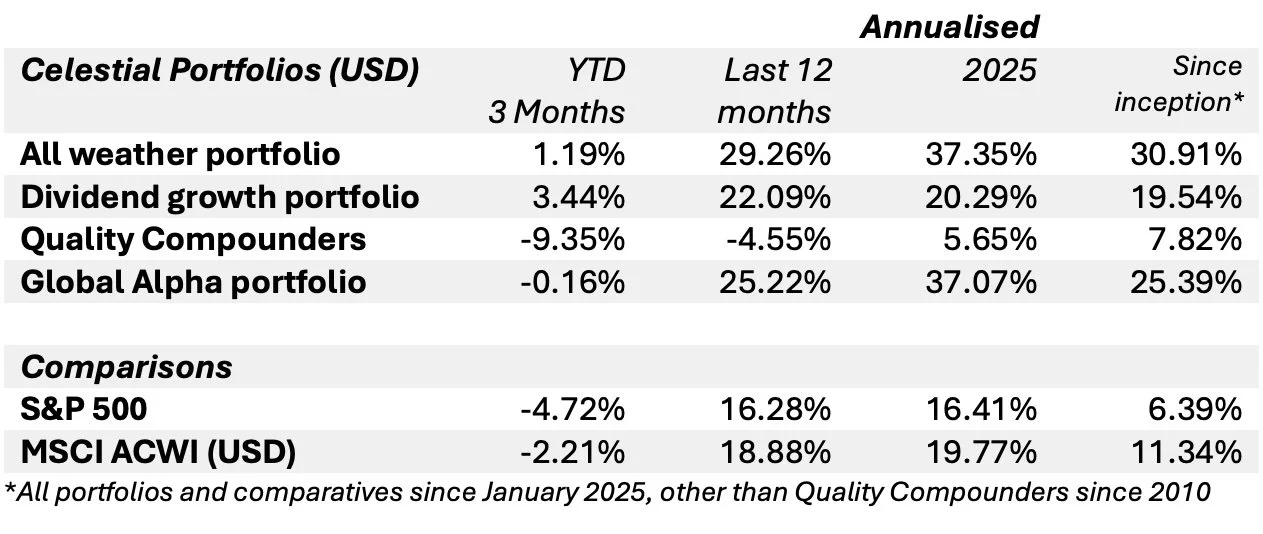
Quarterly and annual returns to 31 March 2026, all in USD:
Our investment philosophy: “everybody’s investment profile is unique”. Each of our four core portfolios offers a distinctive profile as to risk/reward and volatility. Optimum risk/reward exposure can be obtained by combining some of these portfolios.
All weather portfolio
The all-weather portfolio is our lowest risk and lowest volatility portfolio and our second best performer of this quarter – it did what it is designed to do. Low volatility in times of uncertainty. It outperformed the major benchmarks.
As this portfolio is designed to be a provide a return above inflation with low volatility, it was rebalanced in January to its 25% allocation for equities, gold, fixed income and cash in equal proportions.
Dividend Growth Portfolio
This portfolio is for those investors seeking regular dividend income plus capital appreciation. The underlying constituents are mostly more mature businesses and is our lowest volatility portfolio comprised 100% of equities.
The nature of this portfolio is demonstrated by its 3.44% increase over the quarter, significantly outperming the major indices. The dividend yield achieved on this portfolio was 4.85% for the preceding year.
No changes were made to this portfolio during the quarter other than the dividends earned in 2025 were re-invested in the Asia Pacific dividend growth ETF at the end of the year. The Asia Pacific dividend growth ETF has exposure to established, high quality companies in Australia, Hong Kong, Japan, New Zealand and Singapore. It is our expectation that this region will deliver strong growth over the medium term.
Quality Compounders portfolio
This portfolio, comprised of quality companies, with growing free cash flows, managed by outstanding management teams, has been an under performer for the quarter, declining by 9.35%.
Over the past three months, with the expectation of higher volatility over the next 2-3 years, we have derisked the portfolio by increasing the number of positions held and trimming certain of the larger positions. We have also sold out of HGT, the UK listed serial acquiror of software businesses. We further increased the cash and near cash (T-bills) component of the portfolio to approximately 30%. Our shopping list is being refined, and we will deploy this surplus cash over the next few months.
Let’s analyse the portfolio characteristics at quarter end:
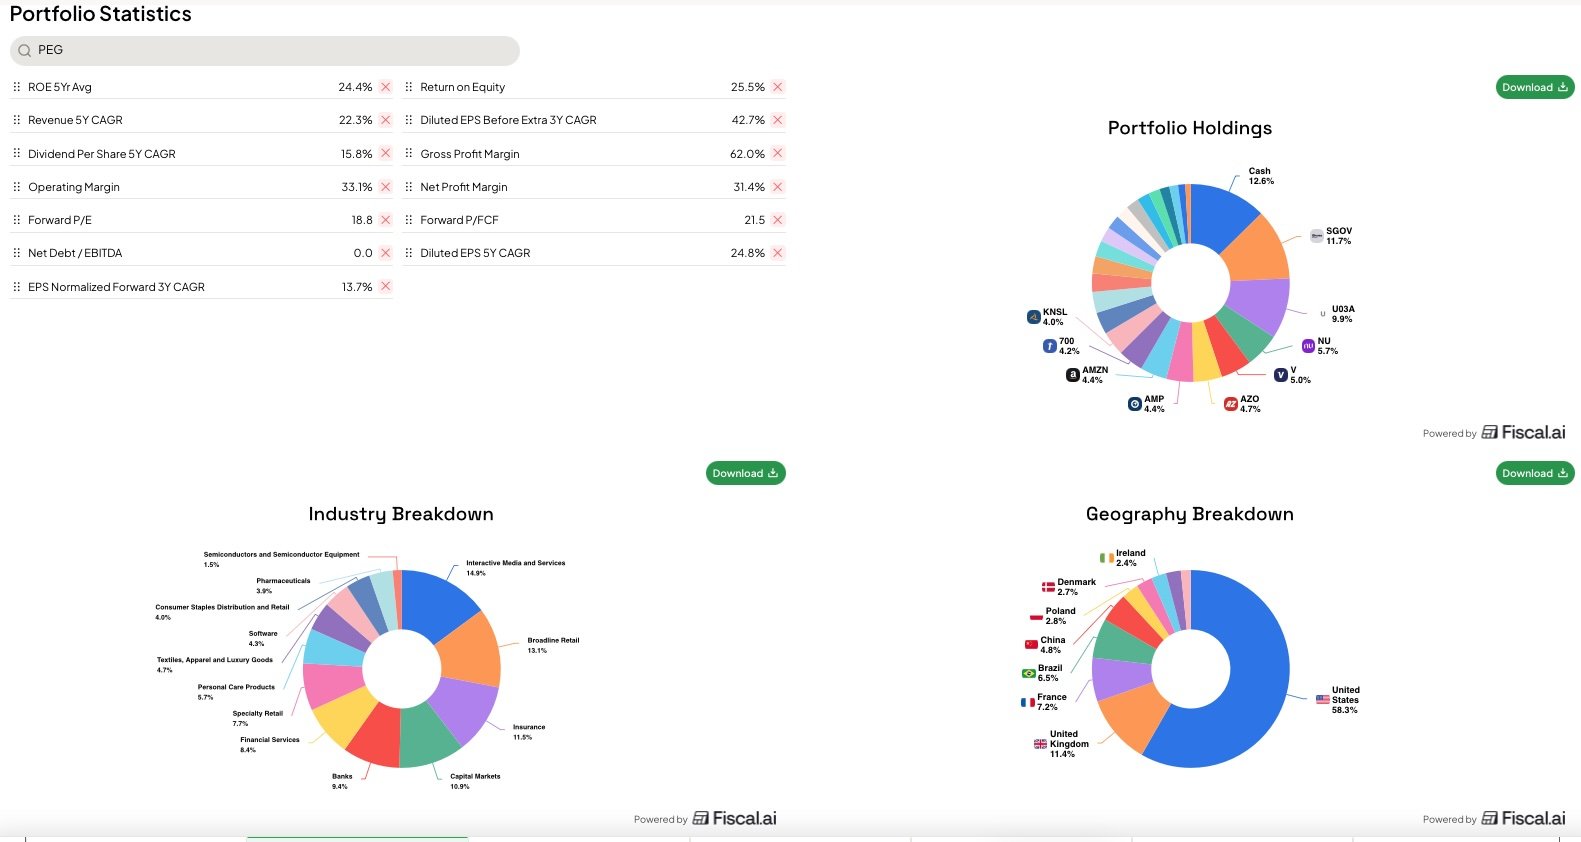
The portfolio currently comprises 19 shares and 5 ETFs. Two of the ETF’s are invested in T-bills, one accumulating and the other paying interest monthly. The other 3 ETFs are all US listed instruments providing exposure to three different opportunity sets in China, they comprise approximately 6% of the portfolio. In the geographic breakdown above, they are included in the US listed shares.
The industry exposure is well diversified as detailed above. Geographically, approximately 52% of the portfolio invested in US businesses and the balance widely dispersed. Diversification is an inherent part of making sure risk is under control.
Our portfolio companies have an average return on Equity of 25.5% vs the historic average over 5 years of 24.4% - an indication that managements are improving their capital allocation skills.
The portfolio has an average Gross Margin of 62% and an average Operating Margin of 33.1%, well above the S&P 500 averages.
On valuation, the portfolio is trading at a forward PE of 18.8 and a forward Price to Free Cash Flow ratio of 21.5. Reasonable valuation levels.
I believe the portfolio is set to grow faster than average over the next five years and meets our quality compounder standards.
Global Alpha portfolio (formerly Global equities)
This actively managed portfolio of specific country and industry ETFs delivered a 31.95% return in 2025 and is down by 3.89% to end of March. This is our highest volatility portfolio, and short-term fluctuations should be expected – only for the true long-term investors!
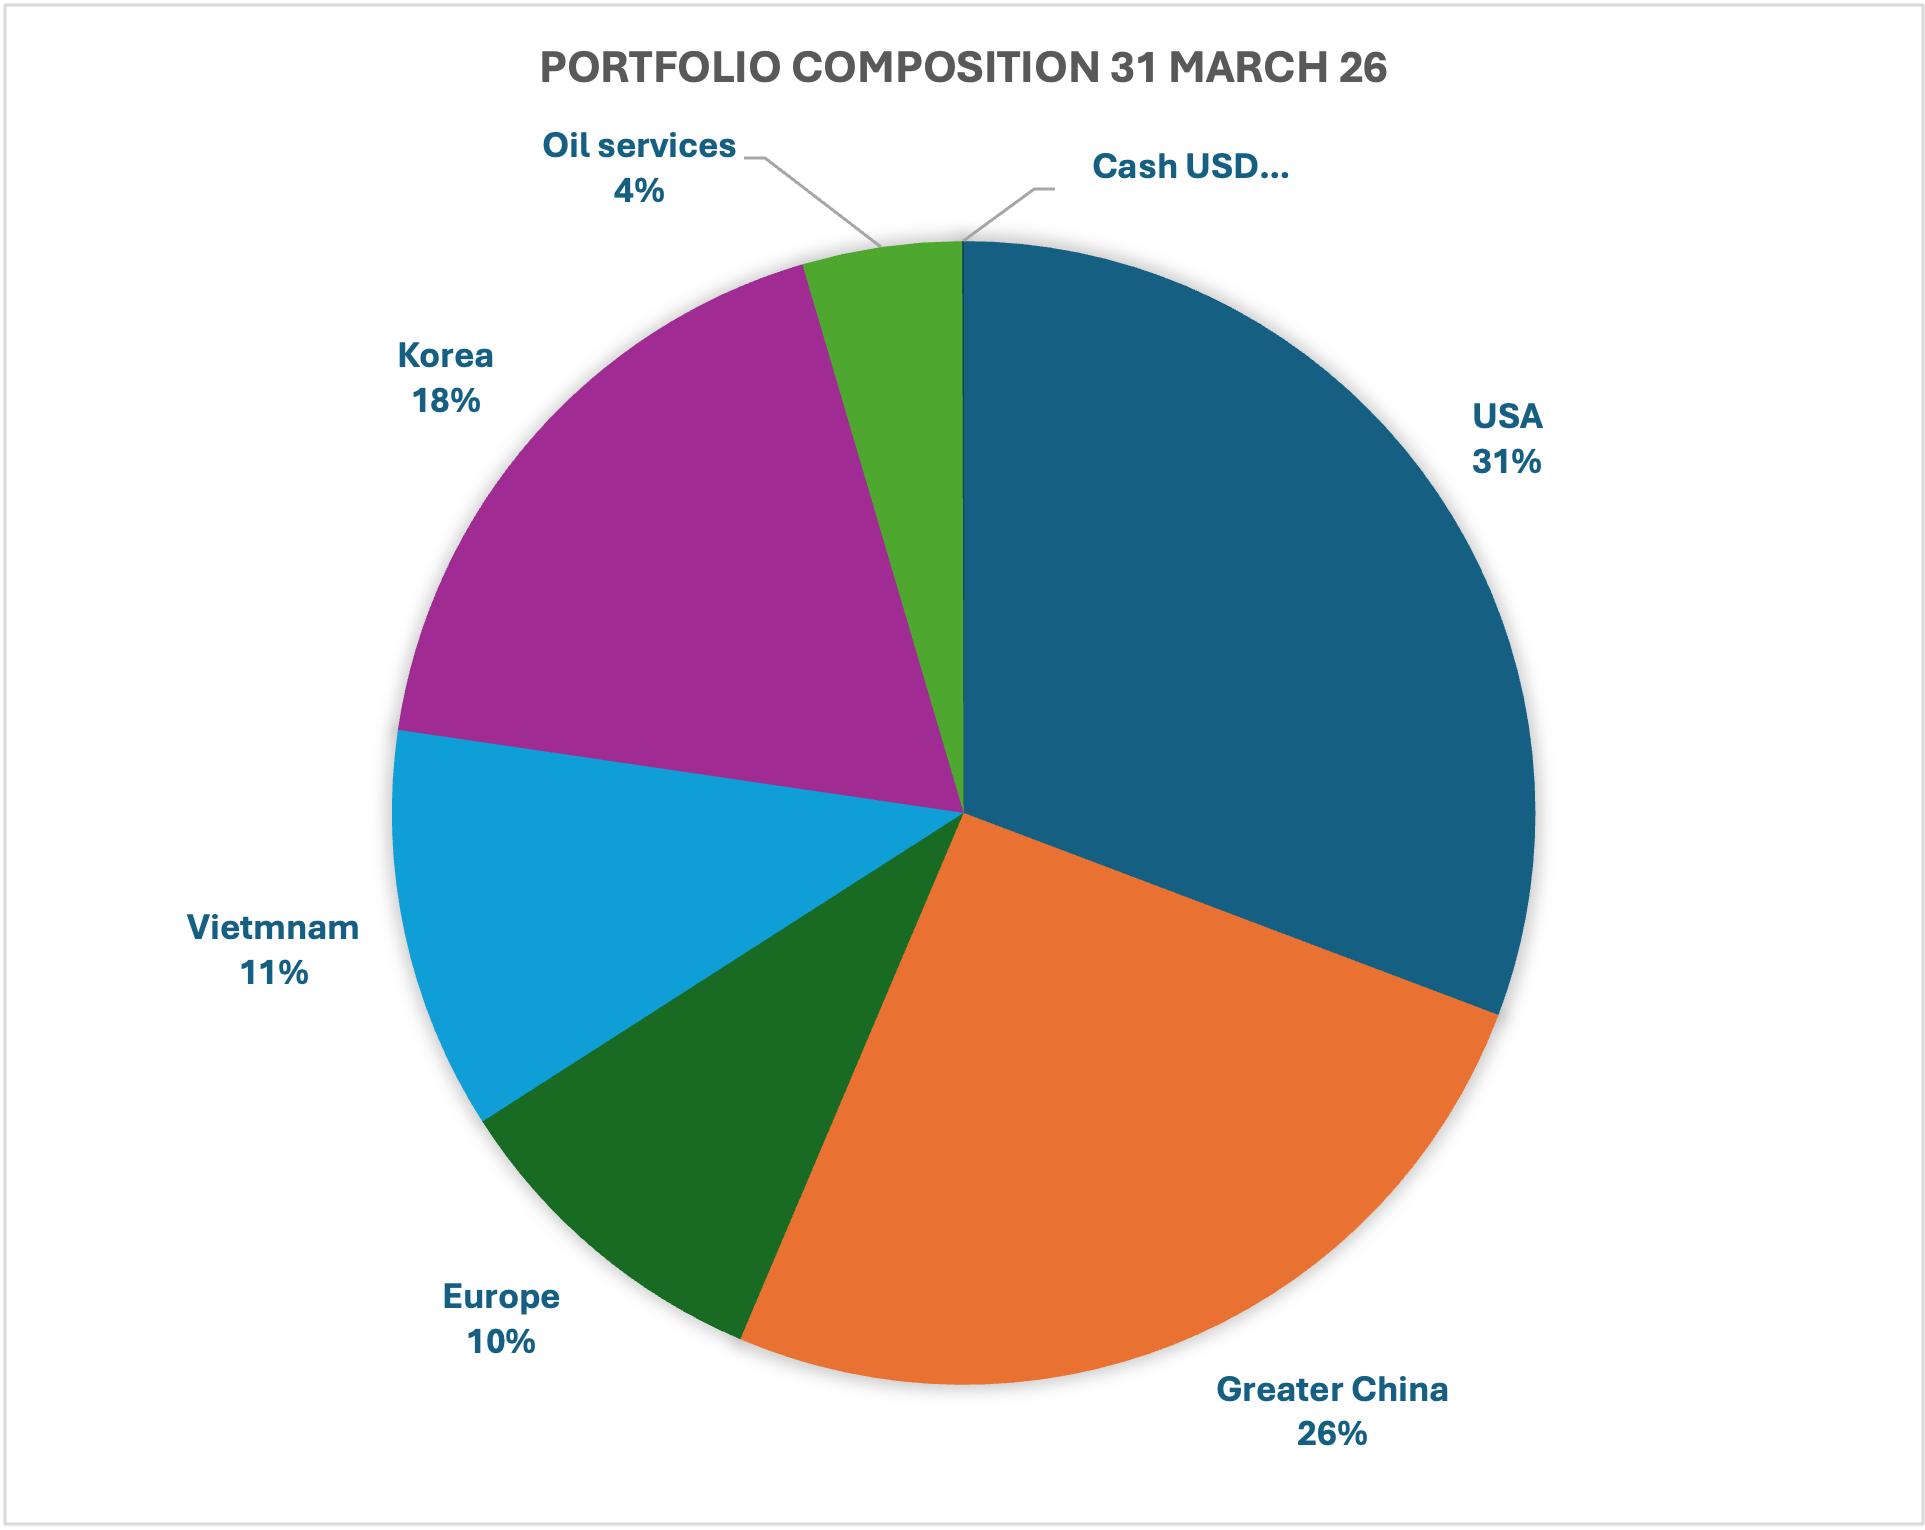
Major contributors for the quarter were the South Korea (up 26%) and the Oil service (up 16%) ETFs - pity we only had an allocation of 4% to Oil services.
The only portfolio change in January was the acquisition of the Oil Services ETF from the dividends received in 2025. The portfolio composition by country and industry on 31 March 2026 is as follows:
Overall, the quarter has delivered a spread of results, inline with positioning on the risk reward curve. We continue to strive for above market returns with risk under control in all our portfolios, respecting that nobody knows where the markets will end up. What is certain is that short term volatility will remain with us.
Volatility aside, we expect growth in the public market securiteis to accelerate once the war in Iran is settled. Earnings revisions of the S&P 500 are trending up, forward PE’s continue to decline, China is well positioned for accelerated growth, India is adding millions of middle class consumers to the economy annually. The increase in productivity from AI adoption is at a truly early stage. Once some of these geopolitical tensions are settled, we the upward trend to continue.
CELESTIAL PARTNERS
Conviction, Humility, Discipline.
Risk Disclosure
Investing in financial markets involves inherent risks, including the possible loss of capital. The performance of the Celestial portfolios, as presented in this report, reflects historical results and should not be interpreted as a guarantee of future returns. Market conditions can change rapidly due to a variety of factors, including economic developments, geopolitical events, changes in interest rates, and fluctuations in currency and commodity prices.
Each portfolio is constructed with a specific risk profile in mind, but all investments are subject to market volatility. Portfolios with higher allocations to equities or emerging markets may experience greater fluctuations in value, while those with exposure to fixed income or alternative assets, such as gold, are not immune to periods of underperformance or loss.
Past performance is not indicative of future results. Investors should carefully consider their own investment objectives, risk tolerance, and time horizon before making any investment decisions. We recommend consulting with a qualified financial advisor to ensure that any investment is appropriate for your individual circumstances.
The information provided in this report is for informational purposes only and does not constitute investment advice or a recommendation to buy or sell any securities. Please refer to the portfolio factsheets and legal disclosures for further details.