
Dollar weakness- temporary or structural
Recent declines in the US dollar combined with heightened market uncertainty have prompted investors to reconsider US asset allocations. The prudent long term investor needs to understand the context and consider implications for their portfolios.
We look at why the dollar has weakened, review what has not changed, and how to position your portfolio to achieve sound long term returns. In the second part to this letter, I share the changes we have made to our four core investment portfolios across the risk reward spectrum.
Key Drivers of current Dollar Weakness
Let’s put the recent USD decline into context. The current decline, approximately 1.3% in the current year and a 9% decline in 2025, against a basket of major currencies, puts the dollar back at the same level exactly four years ago. The following is the DXY index and tracks the strength of the dollar against a basket of major currencies. (Note, this index does not include the Chinese Yuan)
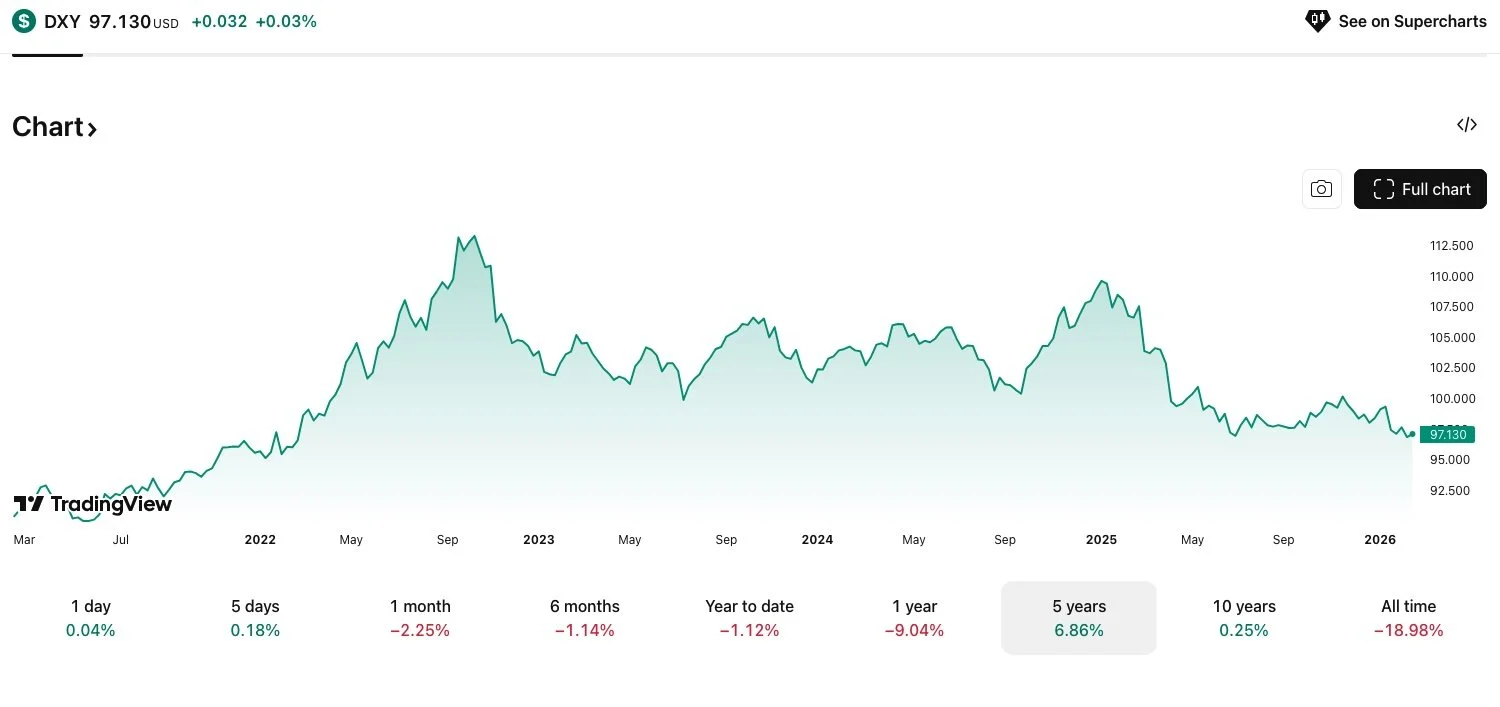
Source: Tradingview.com
Key drivers for current weakness include:
The Federal Reserve has reduced rates from 5.50% to 3.75% since September 2024, this is a 32% decrease in short-term interest rates. Note that the dollar strengthened significantly during the preceding period of rate increases.
Political and policy uncertainty, including recent trade policy changes and events such as the liberation day announcement, have diminished short-term confidence in the dollar and the US as a stable trading partner.
Structural concerns persist, with the US fiscal deficit exceeding 130% of GDP and imports outpacing exports.
Gold and emerging markets exhibit an inverse relationship with the USD; increased gold purchases have negatively impacted the dollar or viewed differently, the weaker dollar has been a major contributor to the higher gold price. The following graph depicts the inverse relationship between the dollar and gold over the last 25 years.
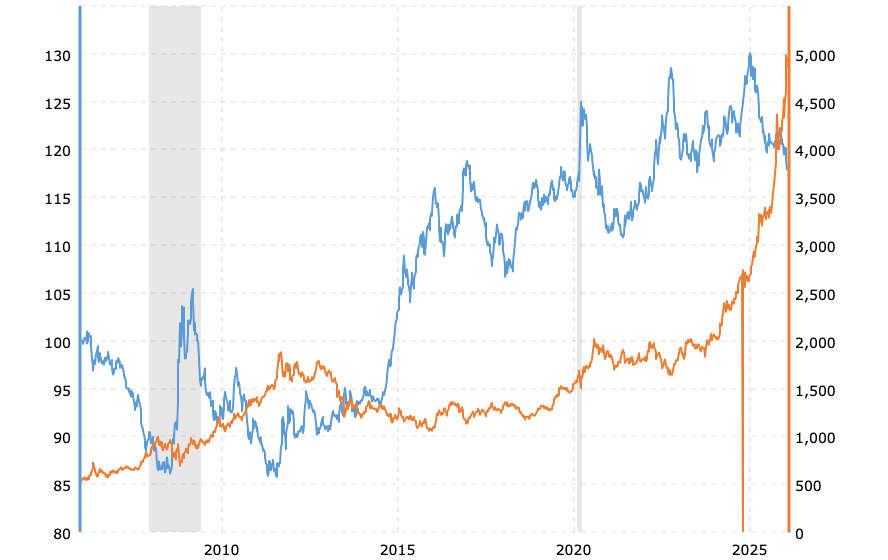
Dollar in Blue, Gold in Orange: Source Megatrends
What remains unchanged?
The US remains the world’s largest economy, with the IMF projecting 2.4% GDP growth for the US in 2026.
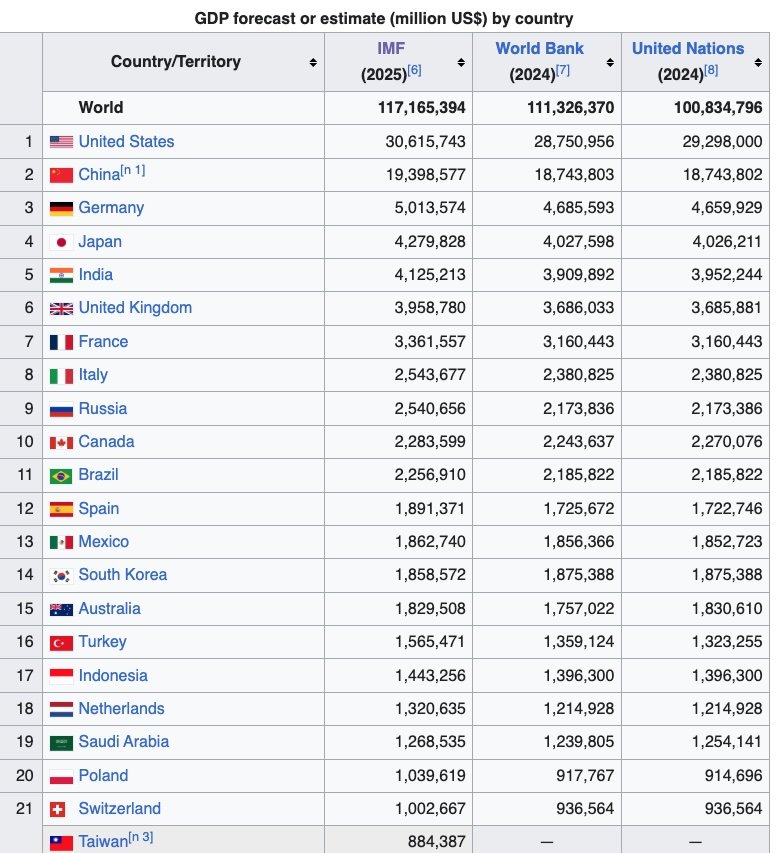
Source: Wikipedia
The US remains is the largest economy in the world, with a Gross Domestic Product (GDP) of approximately $30.6 trillion. China and the EU follow closely, with a GDP of $19.3 trillion, and $19.9 trillion respectively.
If we apply estimated annual growth rates of 2% for the United States, 4.5% for China, and 1.2% for the EU over the next 20 years, there will be a significant shift in the global economic landscape over the next two decades. Based on these growth rates (my estimates for illustration purposes), projections indicate that by the year 2044—just 18 years from now—the Chinese economy will have grown to match the size of the US economy, both approximately $45 trillion with the EU at $25 trillion. The future very much depends on where the greater economic growth will be achieved. Policy decisions matter.
2. US capital markets remain unmatched in size and liquidity.
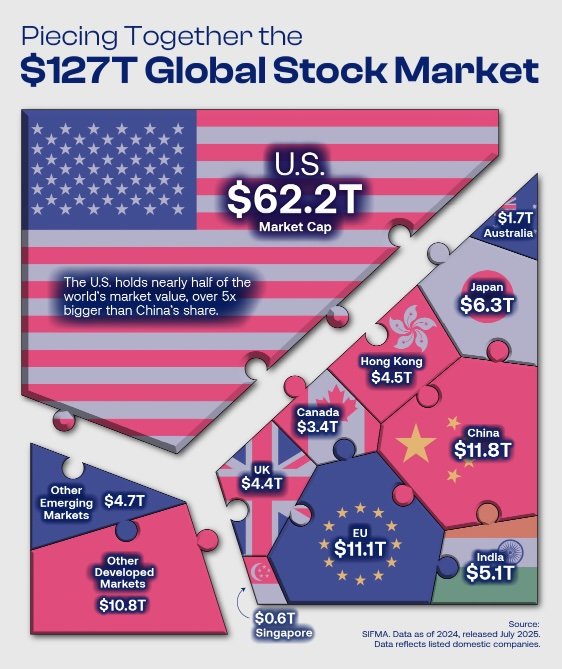
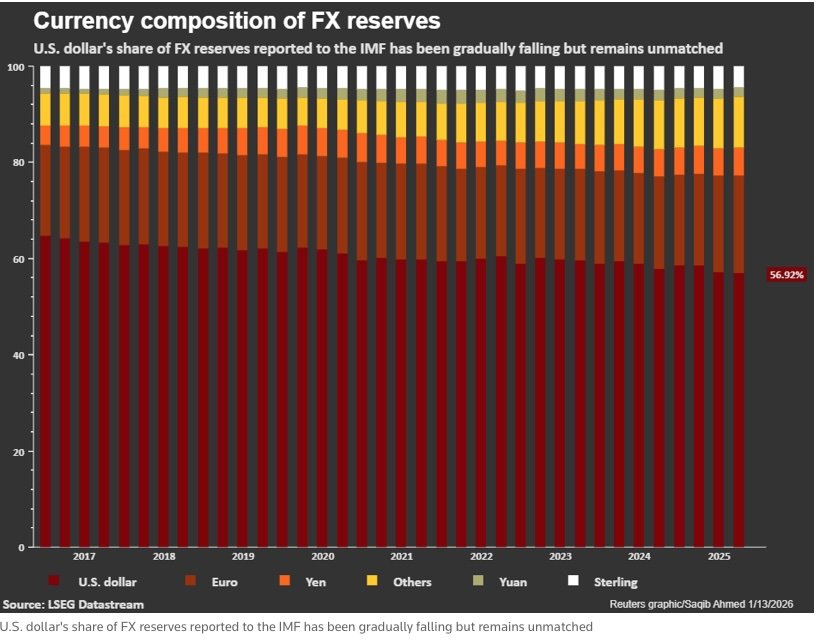
3. The USD remains the world’s reserve currency.
4. Trump has 3 years left in office - this is a blip on investment horizons.
Where to from here?
Exchange rates are volatile by nature, estimated by some to be second only on the volatility scale, to the weather. Even with this volatility, rates are market driven, reflecting long term fundamentals and short term sentiment. For prudent long term investors, current conditions present attractive opportunities in select US-listed securities, particularly those not priced for perpetual growth.
Investors will be well served in this time to maintain a well diversified portfolio by industry and geography.
For South African investors, the ZAR-to-USD real exchange rate is at its most favourable in a decade. Those considering currency conversion this one of the best times to act.
Or in the words of the sage from Omaha, don’t bet against the US of A!
Portfolio Updates
At Celestial, we manage four portfolios across the risk-reward spectrum, each designed for specific outcomes within defined volatility ranges. Rebalancing is a deliberate act of risk management practice.
A: All Weather portfolio
Our multi-asset portfolio has been rebalanced to its annual targets of equal parts to cash, gold, equities and fixed income. Our underlying instruments has been largely retained with the cash portion remaining in US Treasury bills, the gold portion split 15% to physical gold and 10% to gold miners. The equity proportion remains in the MSCI all country world index.
The bond portion remains in the emerging bonds ETF as we expect this to continue to outperform most other counters. This ETF delivered capital growth a of 7.95% last year and yielded a gross dividend of 5.8% for a total return of 13.8% for the year. Overall a low volatility portfolio across uncorrelated asset classes.
B. Dividend growth portfolio
The only change to the dividend growth strategy portfolio was the reinvestment of all dividends received into the international dividend growth ETF whose major geographic exposure is Japan (19.65%), Canada (13.65%), Switzerland (13.37%) and France (10.61%), a sound balance to the US listed Dividend Growth companies. Sound diversification across geographies in mature businesses paying increasing dividends.
C: Quality compounders
This has traditionally been a concentrated portfolio of 16 to 20 shares. In light of market uncertainty, we have reduced all the larger positions to 2.5% to 3% of the portfolio and we have sold out of HgT, the UK based serial acquirer of vertical software companies. We have also added some starter positions in a number of shares. We currently have 22 shares in the portfolio and a cash buffer of approximately 25% that will deployed over the next few months.
D: Global equities portfolio
The two largest geographic exposures in this strategy are the US and China with a 30% and 28% allocation across six focussed ETF’s offering specific exposure to these economies – we still believe this is where growth at scale will take place over the next few years.
Our two outlier positions are Vietnam and South Korea, both exhibited outstanding growth in 2025. Vietnam continues to be the fastest growing economy in Asia with 2025 GDP growth of almost 8%. With a total population 99.5m people. The country’s extreme focus on education over the last 30 years is starting to bear fruits, with a highly educated work force, the fundamentals are in place for sustained development and growth. This combined with export growth as a non-aligned nation with geographic advantages, consumption, and productivity growth and a vibrant technology industry with a global footprint supports our view that GDP growth will remain strong in the medium term. No change to our holdings here.
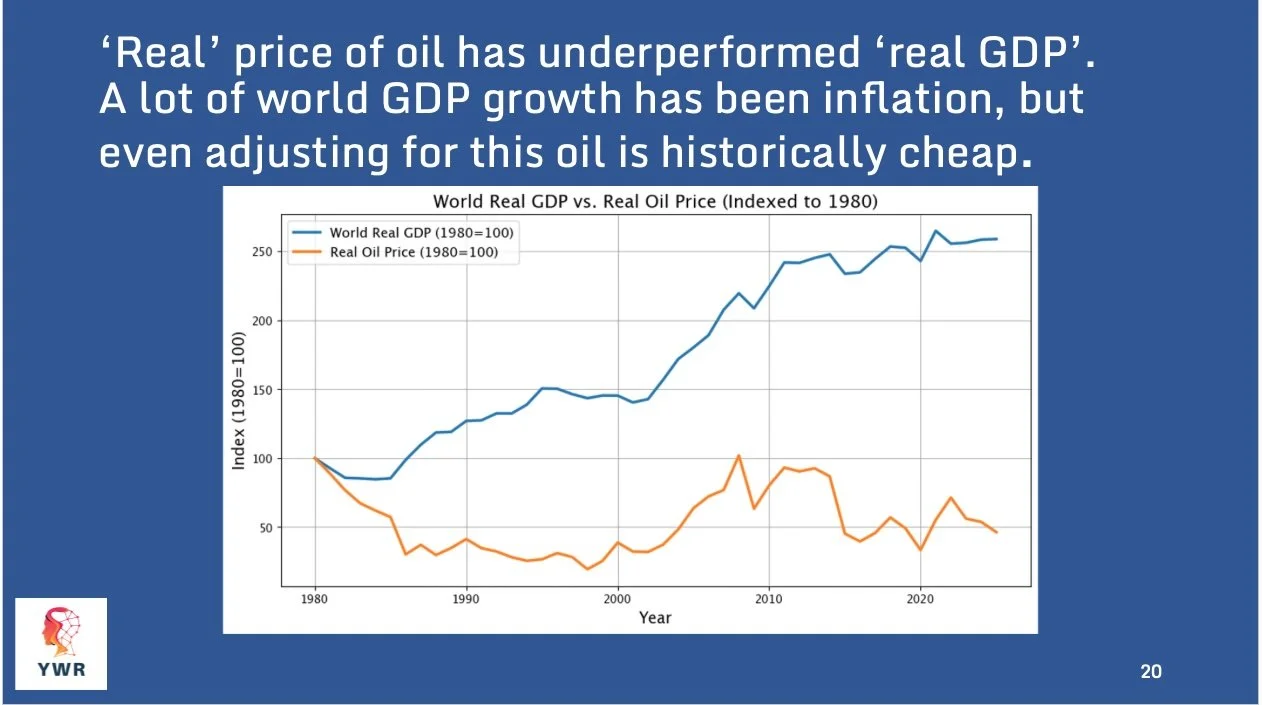
We have deployed the surplus cash from dividends received in this portfolio to open a 3% starter position in the Oil services ETF. We believe there is an opportunity in Oil and Gas will not go away in the near future and it is trading at historically low prices. See the following graph from YWR:
Factsheets on all the portfolios can be assessed here.
As communicated to all clients, our portfolios will now be managed by IBEX Capital (Pty) Ltd (FSP no.49055) with myself and Grant Oosthuizen the portfolio managers. IBEX holds the master license for Interactive Brokers in South Africa and Celestial operated as a Juristic Representative of IBEX for the last 8 years. The continued increase in compliance costs and time makes this a logical change. Celestial’s role will continue as the investment advisor solely to IBEX. This does not impact any of your portfolios or how it is managed, but ensures that the administration is in safe hands with the full team at IBEX on standby to assist. I am very excited for this new phase working closer with the team at IBEX.
Should you have any questions, please let me know.
Warm regards
Chris
CELESTIAL PARTNERS
Conviction, Humility, Discipline.
CHRIS MOSTERT
chris@celestialpartners.com | +27 76 078 1735
Risk Disclosure
Investing in financial markets involves inherent risks, including the possible loss of capital. The performance of the Celestial portfolios, as presented in this report, reflects historical results and should not be interpreted as a guarantee of future returns. Market conditions can change rapidly due to a variety of factors, including economic developments, geopolitical events, changes in interest rates, and fluctuations in currency and commodity prices.
Each portfolio is constructed with a specific risk profile in mind, but all investments are subject to market volatility. Portfolios with higher allocations to equities or emerging markets may experience greater fluctuations in value, while those with exposure to fixed income or alternative assets, such as gold, are not immune to periods of underperformance or loss.
Past performance is not indicative of future results. Investors should carefully consider their own investment objectives, risk tolerance, and time horizon before making any investment decisions. We recommend consulting with a qualified financial advisor to ensure that any investment is appropriate for your individual circumstances.
The information provided in this report is for informational purposes only and does not constitute investment advice or a recommendation to buy or sell any securities. Please refer to the portfolio factsheets and legal disclosures for further details.