
Risk in your portfolio?
In the midst of this AI bubble, what is your investment goal: high returns or loss avoidance?
You simply cannot have both in equal measure. The best one should strive for is the risk adjusted return that suits your personal needs and circumstances. We endeavour to analyse how to go about assessing where to position your portfolio on the risk-reward spectrum so that you can achieve your investment goals.
To better understand the role of risk in your portfolio, I want to share some ideas from Howard Marks, one the most successful investors of our time, from his book, The most important thing. This is a practical way to think about risk in your portfolio and I lean heavily on his ideas.
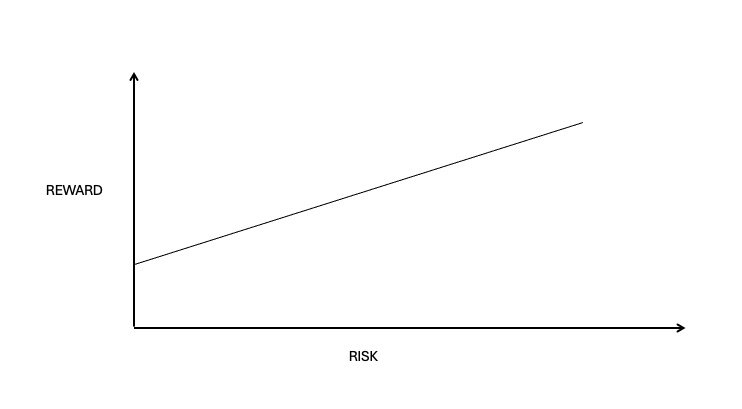
The traditional concept of the risk reward relation is a graph, with Risk on the horizontal axis, reward on the vertical axis and the relationship between the two the upward sloping line in the graph:
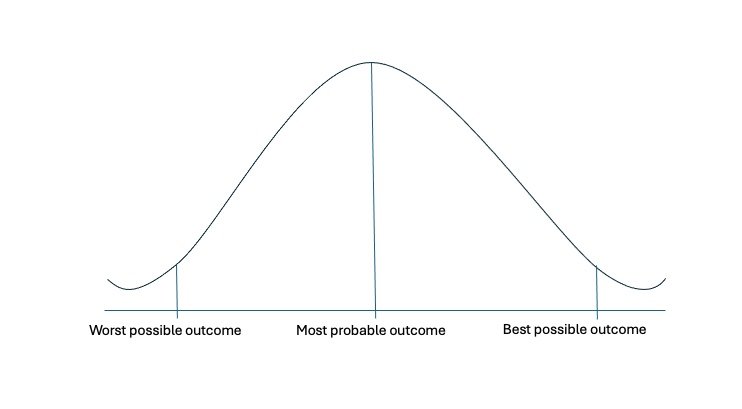
The theoretical relationship depicted in the graph is linear; however, this pattern does not hold in practice. As one transitions into higher risk categories, both positive and negative potential outcomes may increase substantially. Consider visualising the range of possible investment results on different points on the risk reward line as a normal distributions, represented as follows:
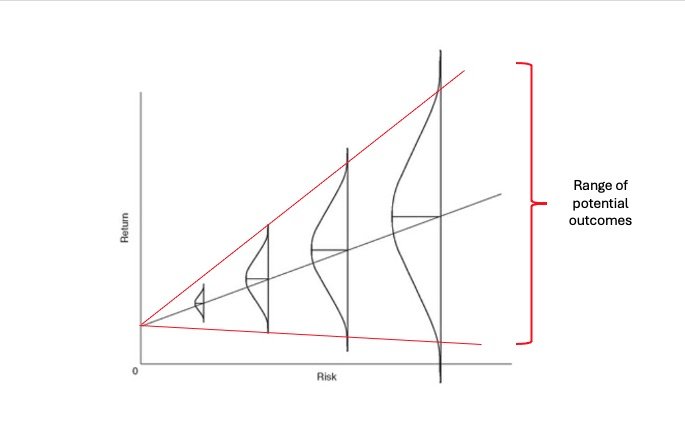
Now we take this normal distribution of outcomes and we plot it on the risk return line, keeping in mind that the riskier investments have have a much wider range of possible outcomes, both positive and negative or put differently, the riskier investments have a higher volatility. This gives us a graph that looks as follows:

Source: The most important thing by Howard Marks
To view this differently, your range of potential outcomes increase as you move up the risk:return line with volatility increasing by investing in riskier assets. Your profit could be greater as you progress to the right, but you loss could also be substantially greater. Potential outcomes detailed between the red lines recognising that it widens as you move out on the risk axis:
How do you find the balance between risk and reward that is right for your circumstances?
You can start by asking with the following questions:
What is your ability to take risk? Thinking about your investment horizons, the consequences if you do not meet your investment objectives, the requirement of regular cash disbursements, or the need to liquidate your portfolio at short notice, will help you decide what your ability is to take risk.
What is your willingness to take risk? What is your capacity to weather fluctuations in price and potentially bear the consequences of loss of capital?
Answering these questions will give you an indication of the extent you want to invest offensive versus investing defensively in your portfolio. At the extremes, defensive investing is buying US 10-year gov bond yielding 4.1%, if you hold it for the 10 years, you will get your money back plus the 4.1%, provided the US government stays solvent. At the other extreme you can buy Google today $318, trading at a P/E of 32 after its increase of 70% year to date, believing the latest views that its in-house chips will replace Nvidia’s and be the next $5trillion company. There is a lot of uncertainty in this view and your return expectations of something better than 4.1% may be met over a 10 year period, but can you stomach the ride along the way?
The greatest investors have outperformed over the long term by avoiding losers and allowing the winners to take care of themselves. This is what risk control brings to your portfolio.
“An investor needs to do very few things right, as long as he avoids big mistakes ”
What is the risk in your portfolio?
Many define investment risk as volatility, but risk is much wider than pure volatility or beta, a measure of a portfolio’s relative sensitivity to market movements.
Risk is inherently the uncertainty about which outcomes will occur and about the possibility of loss, when unfavourable outcomes do occur. Risk is comprised of many different factors and ultimately the measurement of risk is subjective, hidden and unquantifiable. The greatest risk in all investment portfolio’s is a lack of margin of safety, i.e. what price did you pay for the underlying investment compared to its ever-evolving intrinsic value? How much volatility can you handle over what time horizon?
How do you then manage the risk in your portfolio?
Ensure you acquire investments at a good price, preferably below its underlying intrinsic value. Regularly check your intrinsic value for every investment against the ever-changing price that Mr. Market offers you.
Quality investments at the right price helps you can weather temporary downturns more effectively, but you must have paid a reasonable price for such investments.
Ensure your portfolio is appropriately diversified in terms of the number of investments, industries, different geographies and asset classes. This is a principal aspect of risk control in a portfolio but very hard to accomplish, especially in an overvalued market where many asset classes display co-movement.
Ensure you do not use debt to potentially enhance portfolio performance. Debt increases the inherent risk in a portfolio exponentially, especially in a drawdown, when margin calls are made and you are forced to sell.
Carefully consider your risk appetite to select the most appropriate portfolio for your circumstances. You want to balance your offensive with the defensive for the desired outcome.
Structuring your optimal portfolio
At Celestial we offer four core portfolios’, all different intervals on the risk reward graph. We manage the first 4 elements of risks management listed above by allowing for a margin of safety, acquiring only quality individual shares and ETFs, appropriately diversify all our portfolios and never using debt. The only outstanding item for us to consider jointly is, where do you want to your portfolio to be positioned.
Our four core portfolio’s fits as follows on the risk/reward spectrum:
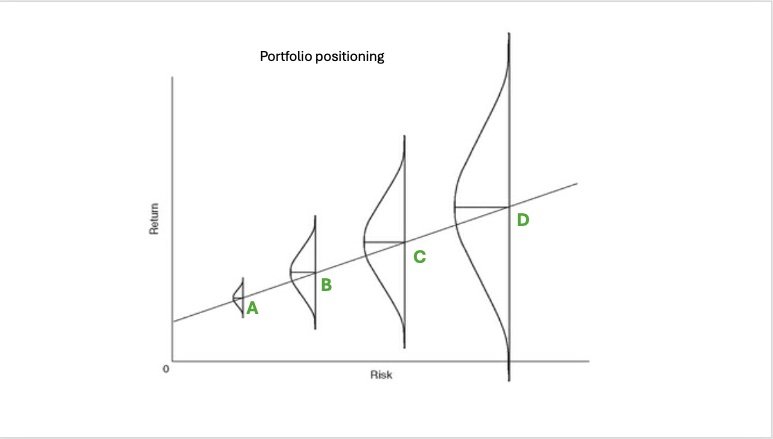
A: All weather portfolio (ETFs only). A Multi-Asset portfolio that launched with 25% allocated to global shares, 25% allocated to global government bonds, 25% to Cash (T-bills) and 25% allocated to gold. The portfolio is rebalanced from time to time as circumstances change. The aim is to provide a return of US CPI +2.5% with low volatility. Factsheet can be accessed here.
B: Dividend Growth Portfolio (ETFs only). A portfolio comprised of global dividend growth companies. This portfolio is suited to investors that seek lower volatility than the broad market and have a need for regular income. As dividend growth companies are generally more mature businesses, which are by nature less volatile. Factsheet can be accessed here.
C: Quality Companies (individual shares and ETFs). A Portfolio of quality companies with an overlay of selected country equity indices, since 2010. The aim is to invest n quality businesses globally at reasonable prices for the long term. ETF overlays are applied to those countries where indices are trading at historical lows with anticipated upside. Factsheet can be accessed here.
D: Global Equity (ETFs only). A portfolio comprised of country-and sector specific equity ETFs. Allocations are actively managed to capitalise on changing opportunities across regions and sectors. Factsheet can be accessed here.
The portfolios can be utilised to obtain different exposure on the risk reward spectrum to suit your personal circumstances. In order to obtain an even finer exposure levels, two or three of the portfolios can be combined to provide an even more focussed risk exposure.
It would be great to discuss your specific circumstances and structure the portfolio that meet your needs.
Yours in investing
Chris
PS: For the technical investor, the following is from an article from FT Alphaville detailing a new investment trend called “Total Portfolio Approach” utilised by some of the largest Sovereign Wealth funds. In short, the approach starts with defining the required return, then estimating the future returns on bonds and equities based on historical volatility for different currencies and regions. These outcomes then determines the ratio between equities and bonds for the respective investment horizons to deliver the desired return. The original article can be accessed here.
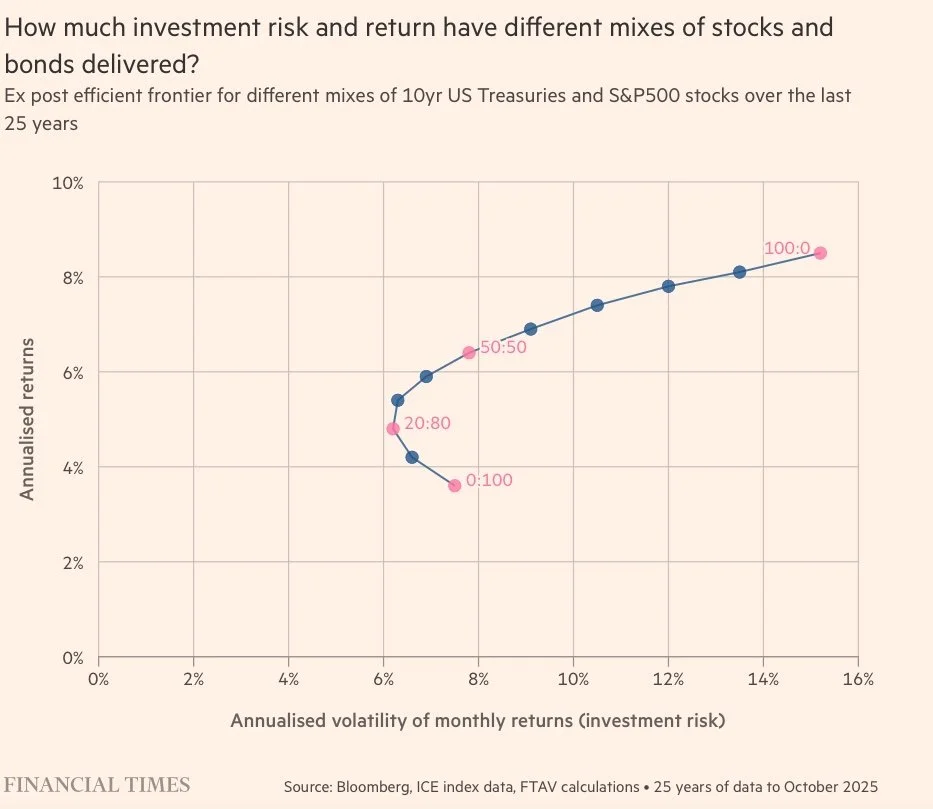
The following graph is an extract from the article that depicts the annualised returns, with the corresponding annualised volatility, for different mixes of 10yr US Treasuries and the S&P500 stocks over the last 25 years. I found this fascinating as stocks only portfolio returned an average 8.4% with an annual standard deviation of return on 15% whilst the bond only portfolio returned 3.6% average at an annualised volatility of 7.5%.
Interestingly the 50:50 portfolio returned 2.8% more at approximately the same volatility as the bond only portfolio. Of further interest is the absolute returns over the last 25 years, including the current 15 year bull market. Given our current valuation levels, this has to revert to the mean at some point!
CELESTIAL PARTNERS
Conviction, Humility, Discipline.
CHRIS MOSTERT
chris@celestialpartners.com | +27 76 078 1735
Risk Disclosure
Investing in financial markets involves inherent risks, including the possible loss of capital. The performance of the Celestial portfolios, as presented in this report, reflects historical results and should not be interpreted as a guarantee of future returns. Market conditions can change rapidly due to a variety of factors, including economic developments, geopolitical events, changes in interest rates, and fluctuations in currency and commodity prices.
Each portfolio is constructed with a specific risk profile in mind, but all investments are subject to market volatility. Portfolios with higher allocations to equities or emerging markets may experience greater fluctuations in value, while those with exposure to fixed income or alternative assets, such as gold, are not immune to periods of underperformance or loss.
Past performance is not indicative of future results. Investors should carefully consider their own investment objectives, risk tolerance, and time horizon before making any investment decisions. We recommend consulting with a qualified financial advisor to ensure that any investment is appropriate for your individual circumstances.
The information provided in this report is for informational purposes only and does not constitute investment advice or a recommendation to buy or sell any securities. Please refer to the portfolio factsheets and legal disclosures for further details.